

OMD Top Thruk Plugin
This plugin saves top data every minute and draws graphs to help investigate performance problems on the monitoring host.
Installation
These instructions assume you use OMD (omd.consol.de).
Thruk includes this core plugin. To enable it, run thruk plugins enable omd or use the plugins section in the config tool.
Check that System -> OMD Top appears in the menu.
Configuration
Define process groups in one of these files:
`~/etc/thruk/thruk_local.d/omd_top.conf
or
~/etc/thruk/thruk_local.conf
For example:
omd_top = squid                   = squid
omd_top = /sbin/httpd2            = apache2
omd_top = /usr/sbin/mysqld        = mysql
omd_top = /bin/mod_gearman_worker = mod-gearman
Define no more than 10 groups so they fit on the graph. Reload Apache to activate changes.
Usage
The cronjob collects top data for the last 3 days. On the start page, select a time range to examine.
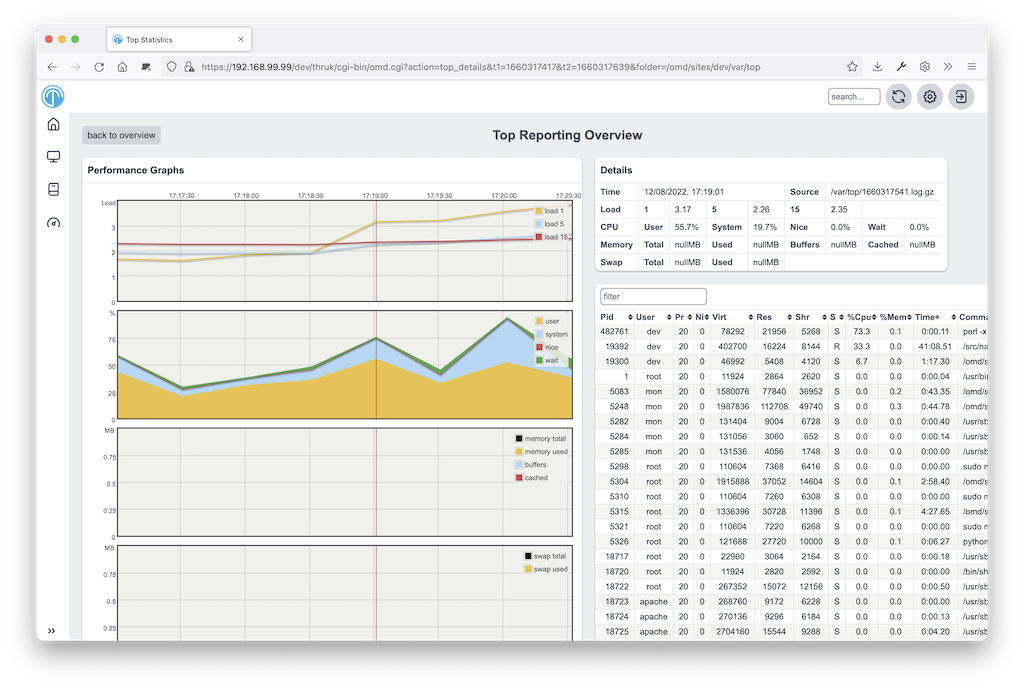
On the second page, select data points to fetch detailed top data. Click a table header to sort the data.
Extending by own Parsers
The default parser reads Linux top data. To write a custom parser, add an input source to thruk_local.conf:
omd_top_extra_dir = WinCPU=var/cputopThen implement a parser, such as OMD/Top/Parser/WinCPU.pm, based on LinuxTop.pm.