root@host:/etc/thruk %> ls -la panorama/
-rw-r-----  1 thruk thruk 22185 Aug 12 10:15 1.tab
-rw-r-----  1 thruk thruk 22108 Aug 12 10:15 2.tab
-rw-r--r--  1 thruk thruk 17170 Aug 12 10:15 3.tab
-rwxr-xr-x  1 thruk thruk  5307 Aug 12 10:15 5.tab
Scripted Dashboards
new in release v2.10
Static Dashboards are a good solution is most cases, but sometimes you need some extra dynamic and a way to constantly update the dashboard. Scripted Dashboards can be used to dynamically generate dashboards on the fly.
Basics
A scripted dashboard is written in perl and the dashboard file must be executable. Scripted dashboards cannot be edited through the web gui, instead the json source of the dashboard is generated by perl code on the fly. While doing this, the perl code has full access to hosts and services or hostgroups via Thruks Livestatus connection pool and whatever is possible with Perl, ex. database querys.
The 5.tab is a scripted dashboard in this example:
Perl
A scripted dashboard basically looks like this:
# title:  Dashboard Title
# user:   thrukadmin
# groups: [{"*" : "read-only"}]

# perl code:
$dashboard = load_data();
# ... add panlets dynamically here

# static basic dashboard:
__DATA__
{
   "tab" : {
      "xdata" : {
         "refresh" : 10
      }
   }
}
The first 3 lines describe the dashboards meta data. The meta data is static, otherwise the dashboard would had to be run everytime a simple list of available dashboards is requested.
-
title: the title of the dashboard
-
user: owner of the dashboard
-
groups: group permissions. see the above example to create a readonly public dashboard.
To get an idea of how the finished dashboard chould look like, just have a look at the existing dashboards.
The perl code section usually starts with $dashboard which will be loaded from
the DATA section. Then you can add panels and icons.
At the end of the code section, $dashboard must contain the complete dashboard.
Functions
You can create your own functions but they have to be a anonymous function.
# create function
my $_functionname = sub { ... };

# use function
&{$_functionname}($args, ...);
Besides that, you can of course load perl modules and use functions from them.
Predefined Functions
load_data
Returns the static dashboard from the DATA block of the dashboard file.
get_screen_data
Returns the screen size of current user. Can be used to adjust layout to screen. Width/Height is the actual available size of the screen for dashboard excluding the size of the tabbar. Offset_x/y defines the start of the dashboard. For example in tabbed mode, the offset y is 25px to compensate the tab bar. Grid snap is the grid size.
   {
      width:    <height in px>,
      height:   <width in px>,
      offset_x: <dashboard offset x in px>,
      offset_y: <dashboard offset y in px>,
      gridsnap: <grid snap in px>,
      tabbar:   <1 if tabbar is visible, 0 if not>
   }
Refresh
There are two types of refresh.
Icon Refresh Interval
The icon refresh interval can be changed like this:
$dashboard->{'tab'}->{'xdata'}->{'refresh'} = 30;
Which sets every icon to a 30 second refresh interval.
Dashboard Refresh Interval
The second refresh interval is the dashboard itself. If a dashboard is already open in a browser, it does not refresh the dashboard json automatically. Instead it checks the timestamp with every request and reloads the dashboard if that timestamp has changed. If the timestamp is not set, then the last modified date of the file itself will be used.
It is usually a good idea to delay the updates a little bit by updating the timestamp only every few seconds like this:
$dashboard->{'ts'} = time()-time()%30;
This will make open dashboards reload the dashboard source every 30 seconds.
Other Script Languages
new in release v2.38Since release 2.38 you can write your dashboards in any language you like. The tab file has to be executable and must return the json decodable representation of the dashboard. See the shell script example at the end of this page.
Environment
new in release v2.38The following environment variables are set:
-
DASHBOARD= the id number of the dashboard -
DASHBOARD_FILE= path to source file -
REMOTE_USER= user name of current user requesting the dashboard -
REMOTE_USER_GROUPS= contact groups for the user above
Debugging
new in release v2.38The thruk cli tool can be used to evaluate the scripted dashboard.
print json data of dashboard nr 5.:
%> thruk panorama json 5
print json data of dashboard with given path:
%> thruk panorama json ~/etc/thruk/panorama/5.tab
Examples
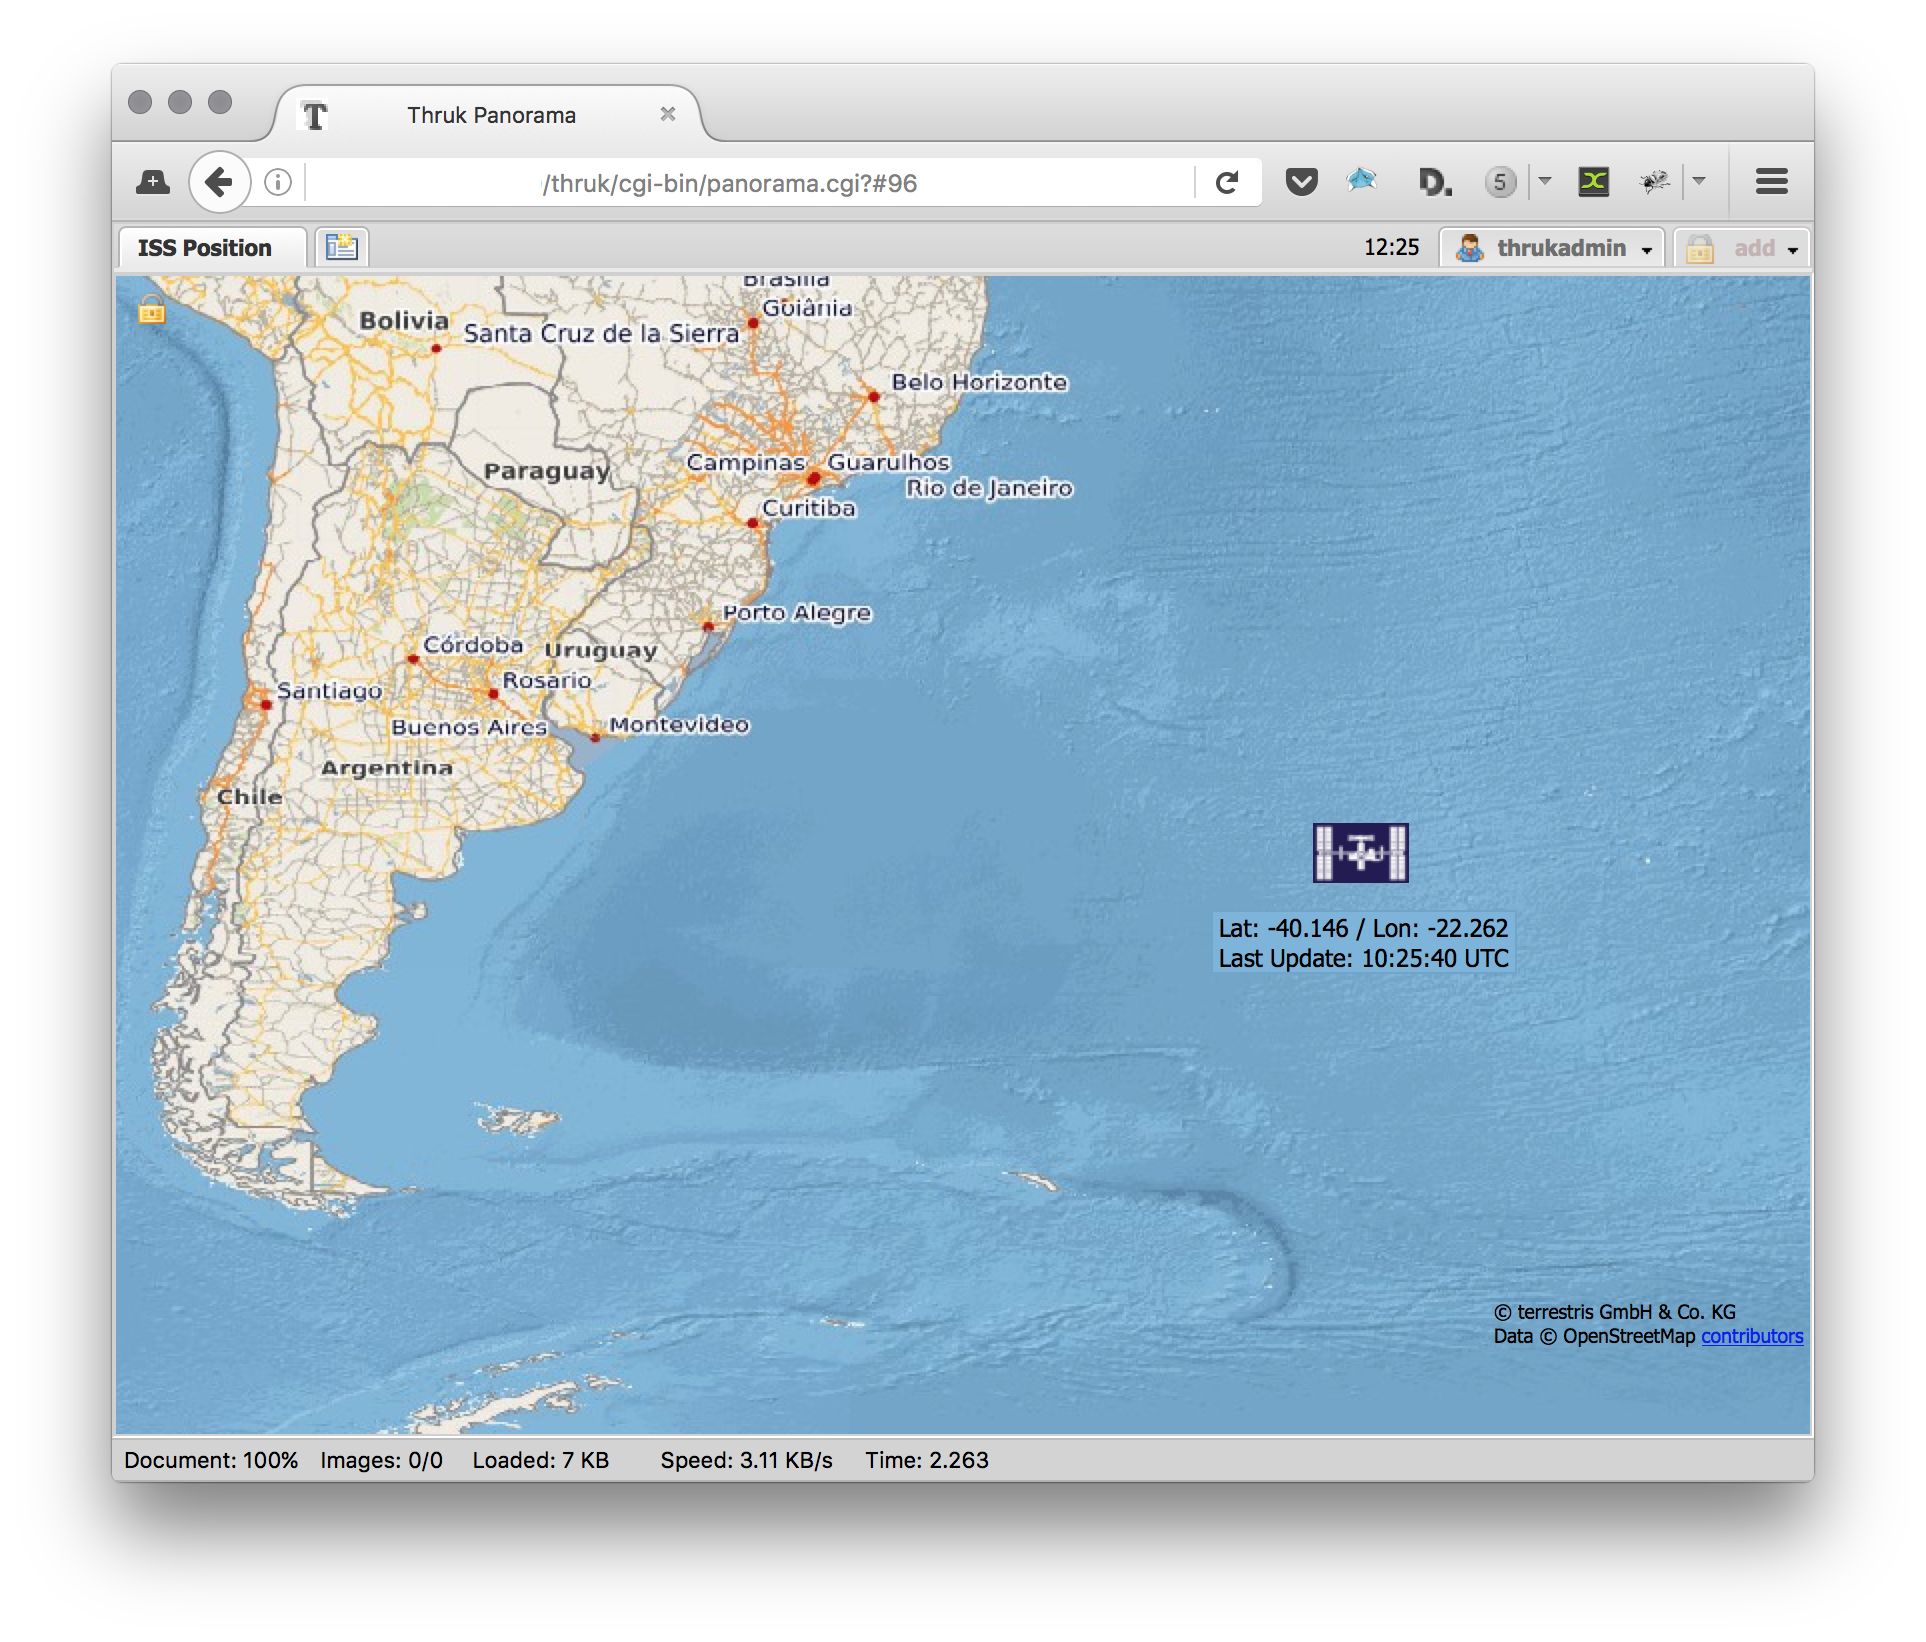
ISS Position
The first real example creates a geo map with the actual position of the ISS Spacestation. This example also shows how to use base64 decoded inline images for static icons.
# title:  ISS Position
# user:   thrukadmin
# groups: [{"*" : "read-only"}]

# get actual position
$dashboard = load_data();
my $panlet_1 = $dashboard->{'panlet_1'}->{'xdata'};

# get actual position
my $raw = `curl -s http://api.open-notify.org/iss-now.json`;
my $data = decode_json($raw);

# set current iss position
$panlet_1->{'map'}->{'lat'} = $data->{'iss_position'}->{'latitude'};
$panlet_1->{'map'}->{'lon'} = $data->{'iss_position'}->{'longitude'};
$panlet_1->{'label'}->{'labeltext'} = sprintf("<center>Lat: %.3f / Lon: %.3f<br>Last Update: %s</center>",
                                               $panlet_1->{'map'}->{'lat'},
                                               $panlet_1->{'map'}->{'lon'},
                                               POSIX::strftime("%H:%M:%S UTC", gmtime($data->{'timestamp'})),
                                               );

# set map center
my $_nearest_int = sub {
    my($x, $val) = @_;
    $x = int($x);
    my $rem = $x % $val;
    return($x-$rem);
};
$dashboard->{'tab'}->{'xdata'}->{'map'}->{'lat'}  = &{$_nearest_int}($data->{'iss_position'}->{'latitude'},  20);
$dashboard->{'tab'}->{'xdata'}->{'map'}->{'lon'}  = &{$_nearest_int}($data->{'iss_position'}->{'longitude'}, 20);
$dashboard->{'tab'}->{'xdata'}->{'map'}->{'zoom'} = 4;

# make dashboard update every 30 seconds
$dashboard->{'ts'} = time() - time() % 30;

__DATA__
{
   "tab" : {
      "xdata" : {
         "refresh" : 10,
         "map" : {},
      }
   },
   "panlet_1" : {
      "xdata" : {
         "appearance" : {
            "type" : "icon"
         },
         "cls" : "TP.StaticIcon",
         "general" : {
            "src" : "data:image/png;base64,iVBORw0KGgoAAAANSUhEUgAAADAAAAAeCAYAAABqpJ3BAAAABmJLR0QA/wD/AP+gvaeTAAAACXBIWXMAAAsTAAALEwEAmpwYAAAAB3RJTUUH4AgKCRgtTUjlJAAACMlJREFUWMPVmGuMG9UVx3/3zoxnbK937fV6H97dFAIhAZqG8FIThRRo1AcCQqNS+kJFfasf+hBCRUWiVR9f2qpIpVKLVNEvVVrRUhSgKICESKs0hAAhQEPT3U2AXe/L67W9a3tmPJ65/TC28SZsSNQ2EvfTHunumXv+55z/OX+LC0Z2Kd7DRwcwTYN160cRQiCEYLGwRE+yCylDe2a6QH6+eE4f1j+QIjvch+8HBIGiXK6STncTBAG+HzA+NkXd9cIA0n09/ODHXyZiGGiaZO8Tz7Ft+yaiURPD0PntA4/x8J+eOacBXHvdFXzl6zdj2y627XJg/2t8/MYtOLZLtepw57fuZ2Y6HwYAkE73MDDYi1JhRnrT3QyPZABBxDTOfWkYGiNrBlAqIDeVRzc0RtcMoJRidmYRITpKSAhBpWLjTebRNInvB1QrNlOTeQxDw/f9cx6AUrCQL2HbLrWqDUA+X8J1XJaX7ZU9oJTCNCOkersRAqSUmFZoa5pESnl6tHSNiGngN3xc1wMV+oyYYUm6bp0gUAghMAwdw9BpNHzqdW9VnwJIdMewomYbwEQiRixm0YlnmAEEvu9j1xykFCilaDRCW9c1lFqdqIIgYOOm9dyyazvRmMnsdAEjYhCNRhgY6mV+rsjU5DyZTBLHdunLJIlEDJ5+8hB7nziAaNXCyRkAXKeO63o0GuGLXbeOV2/gdQSut6+rVtyiA4NOe/VUW6ZBNttHT7KL887Pks32MTiUBqBSqQECFQQcn8gRBArX9ejqip7Wr3jHN5z6Hr0VrW5oxOMWQoQ9Yega8S4LKSVSrB6EENDwA2zb5cSJHLVqnXiXxeJiiS1bNxGJGOx79iXSvT1Uqw66IRgdHWyjeroIrGgEXdeoNnsgakWIGDq1mnNSCQlBoVBkcnKaSMTAa3gUCkWmZ2axLJO6t3qtSik5/OIxXntlol3rSim6EjFGR4eIRk0e+fM+ZmcKtL5lmka7J1YvTcXE+JsUi0uYpgUKxifepFxaBiXbedBbFdTT0002O4CUgpcOjdPdk6CnZwhd19B1/ZS6bz0eoNHwT0H0a9+4hZ2f2E6lYnPndz/LXd++nxZhOE79XVlICsHw8BB9fWnK5QoIGB4epD/TR6lYodWVspUuvxHgOh51t4FCddjeiiZWCrZs3ciWrRtZtbcVJJNdmFaEer2BZZmnfezAYC837txGPB7tcKHw6g1cx8NvhIB5dR/Xqa8Aq02jsbhFpj8FCjQpicUtBrNppBBomraia2/edQ0geO4fr4EQZ8Lq7b+uvPpipJTMzxV448QsAOevzfLN73yKwy8ca9e7EILedDd+EDAzvQBAb283SimEWDyVRo8fn+Lw4dcxIwa27fDmG9Mc/ec4pmlg1952igjvt+x3quNABSuy07p/1dUX85sH76ZUrPDk3v389Ce73/aLWAFGw/M5ePBVFgslYrE4ddfjuQNHKJWW0TS9jYkOkMvlefCBR7nre58nP1/GiESYmsqTSnVRLFbJjmS49dMfRgiBUmAYOgi49TM7ECLMoApCj4ahc8FFw5x3/hB7/rKPwkKJRHecz93+UbLDGeIxC01qXHLJWm697XoQgoHBXqZzeT7ysaupVEKw+vqTVJZtLtu8gXK5SixmkelPsuZ9Q9z3sz8yPZ3vnAMwN1ekXvcoLpZZKi9Rdx3iMYtioUytWkXKoANS1UTOBxSDg2muuOpSAl+R6k1w4boRnn3mRd6/cS2xrih/3bOfrds+QKY/RalUQWqSoWyGgaEUszMLCNH0LQKE8BFCUK0ss1goUa97zM8XcJ06UodUsnvFZqwDDA72cvc9XyDwBdnhfsbGpti0eT2pVDcjowPs/v2TPL5nf/ufLrt8AwAP/eEZAhXwwa0b+eRtO5BSkEwmqNkOiUSMsbEpFvJlLt24FikFwyNpHCfkcNPUef7AUf7+tyN86LrLuWnntTy19xC5yRDZnbu2c/GlF1AqVgl8ePWVE1y/40qWyjZ3fOlGJifzzM0WwgCkJrlowxqGsn0opTjy8jgXrhtldM0AQggef3T/SdNXNadryEooQboviWVFmmVkoOmCF54/SrlUJdFtse2azaT7eto+XNejf6CX0TWDpFKJsNGDkP+lFMTjUTZfvh6lFJNvzXFiYporrtyAEILp3AKaJlcOsnKpQrXqhttow6dcruKO5cLFy1vJ8Y8+sq89hgWC+blFHtr9NLrxNlsNDqW54aat+A3FUrnCU3sPoJpL3vBIP+suWsMXv3ozt99xA0dePsYvf7GbUmkZKUUbpNxUnlrNxXFcFJDLLWDXXGpV51QajXdFyfSnUAo0TRKPWwxl+xBCoOkrt9GDB15vrxFCSN44McMPv//gijv33HsH1++4iRPHc5RKFX507+/am2o8ESWZSjQVHywt1SgslNF1rWNFEfRlkvh+0J7imUySIFDMzy2eukrUag6zM4W2HrBrLrMzhaYeCM56nzcto02ihqEjNYloolutOm22aQHR+fgWqMXFpVCRNWl8cXHpDPRAc0UwTYNU6sz0wNme1sJ4+juCRCKGZZn4zcmb6IoRi76jHgDfD8d0Sw/4QYDr1tF0eVo98G7HMPR2XZ+dJAPPa+C6XrsCPK+B5zVoNBon6QEhcBwX1w0FTBAEOLbDQqNOJGK0l7ezOY/t2c+/j03ieT4L+RKe1zhLSakolZeoVmo0vPD75XKZatXGcU4OYIVYkB227LDP7hw6eJRDB4/+t8XW/H7n7ilXiBq9taBFrQhdiThSCqSUWFGTZDKBpv/ve+DM+kSQ7EkQtSxKxWUAenoSxGJRik17hSKTuoZpRdoNpmmhsNc0+a4N9/+JAIyIAR00bkRCNuvUJ20arbse5dIymiYJVNC2dUNrL2rn+meVaqWGbbvh/ACqFRvXdbHtkwZZqbjMr3/1MGYz4omxKY796y0s00AIwZGXx895AC88f5T7fl4n8AMcp04ul2difApUuIaUS5UwUe/1H3f/A2qiDnEIg9p7AAAAAElFTkSuQmCC"
         },
         "label" : {
            "bgcolor" : "#7eb4d9",
            "bordercolor" : "#71a4c9",
            "bordersize" : 1,
            "fontcolor" : "#000000",
            "fontitalic" : "",
            "fontsize" : 12,
            "labeltext" : "",
            "orientation" : "horizontal",
            "position" : "below",
         },
         "popup" : {
            "type" : "off"
         },
         "layout" : {},
         "map" : {}
      }
   }
}
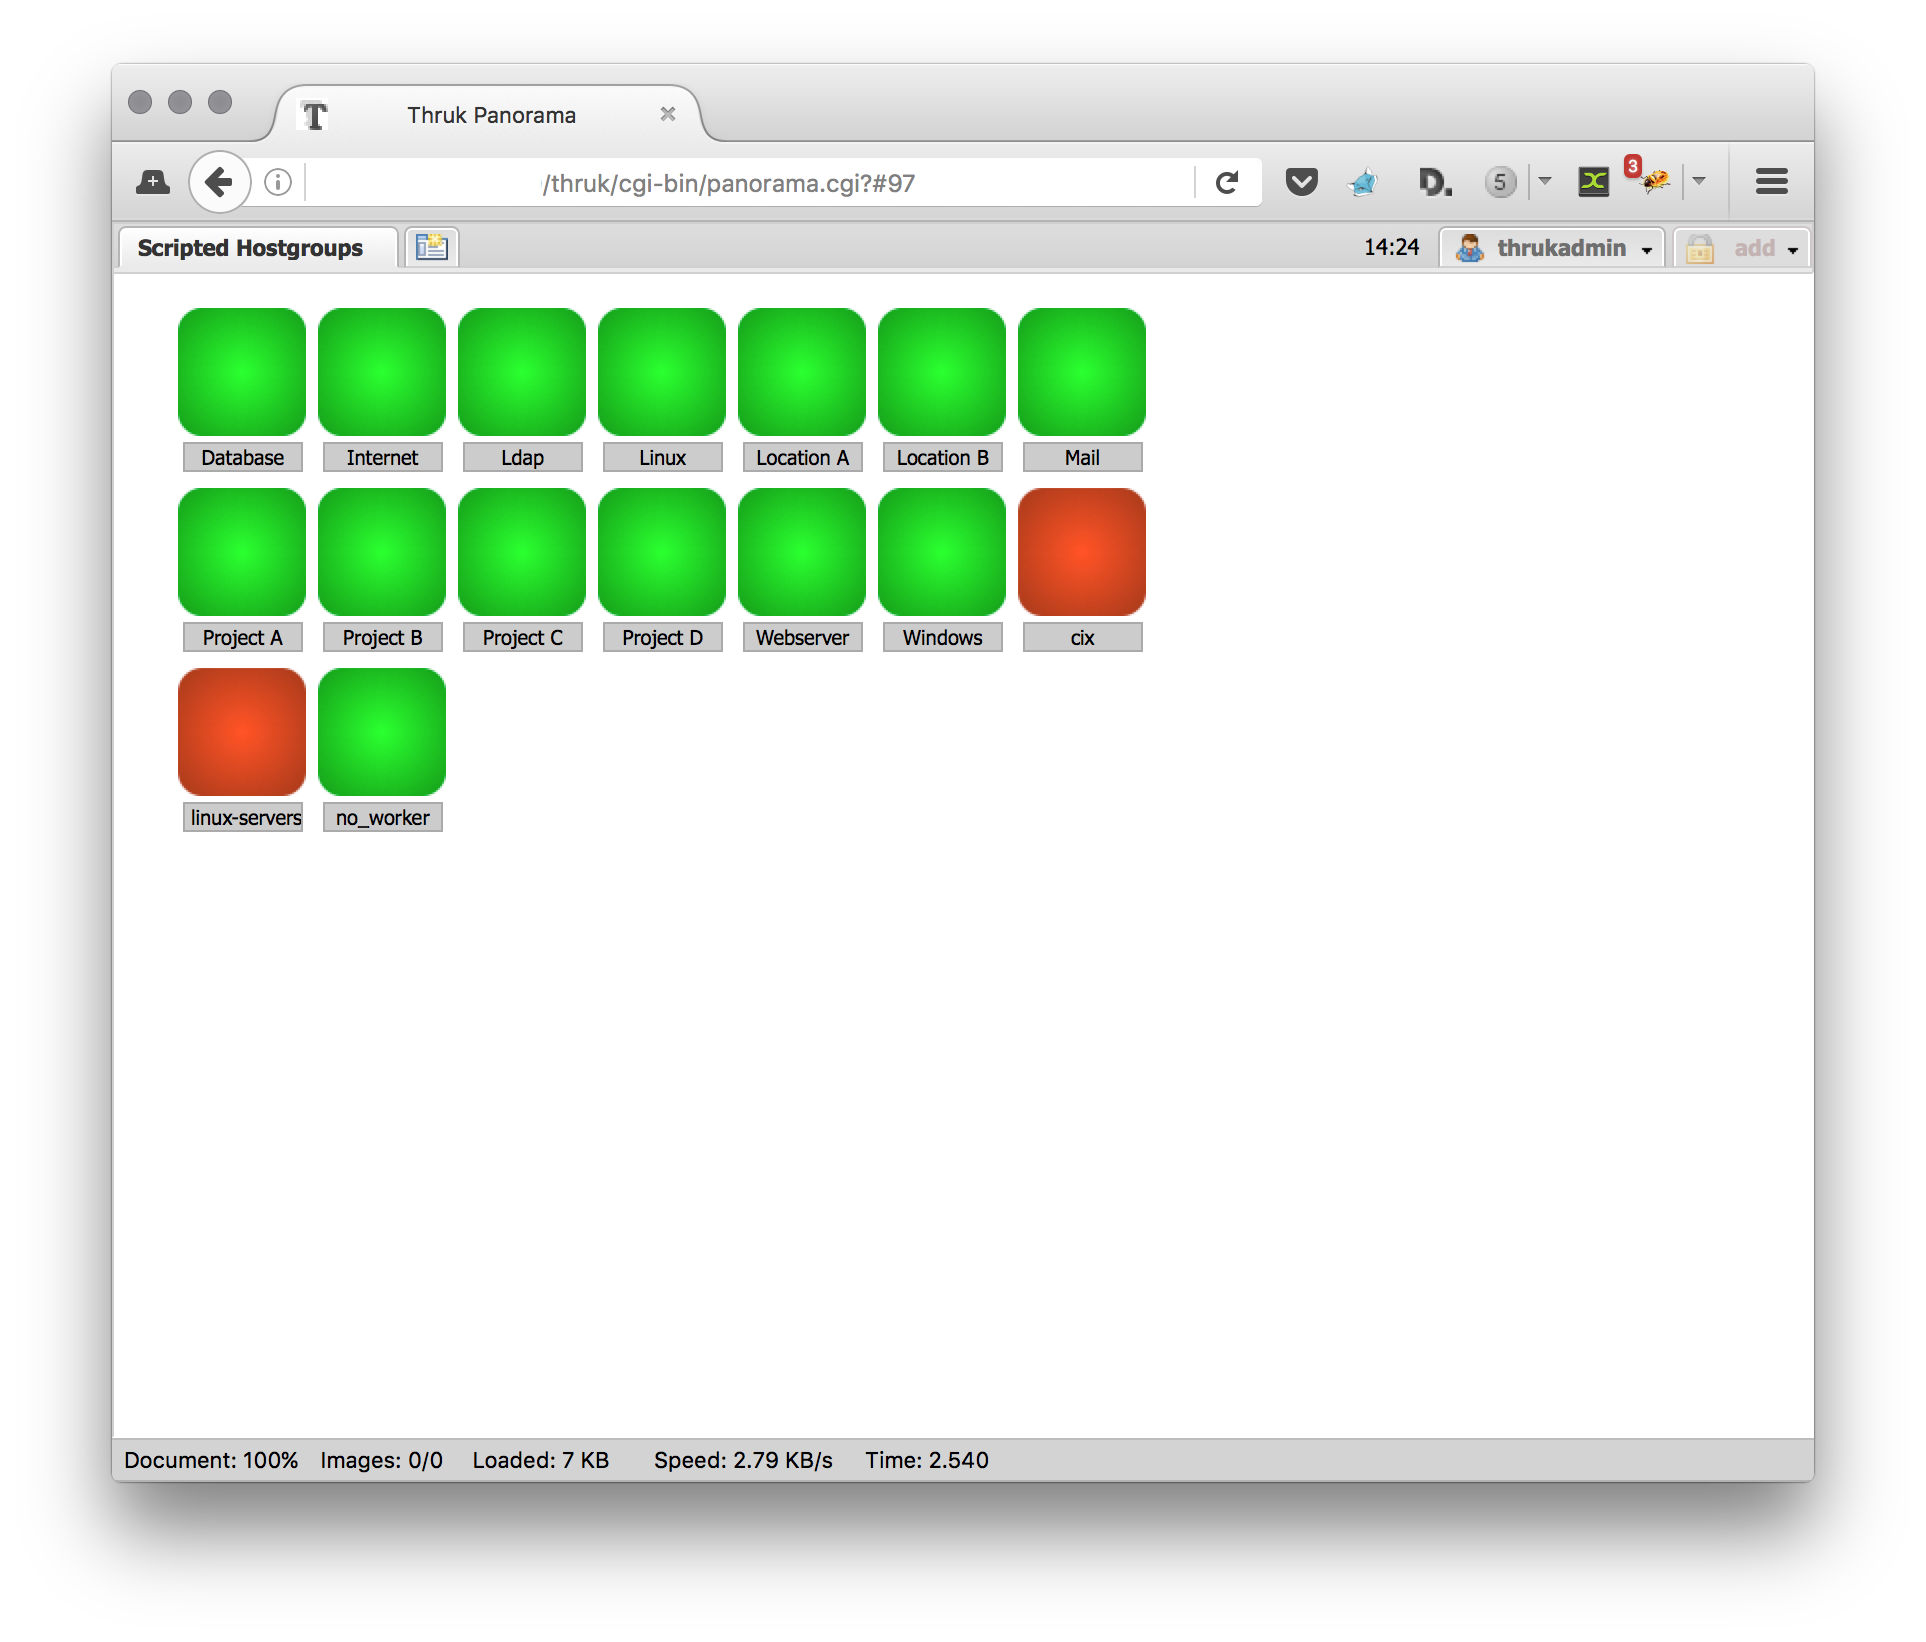
Hostgroups Overview
This example fetches the list of hostgroups and creates an icon for each of it. This dashboard does not even have a DATA structure and creates the dashboard completely from the script.
# title:  Scripted Hostgroups
# user:   thrukadmin
# groups: [{"*" : "read-only"}]

$dashboard = load_data();

# fetch all hostgroups sorted by name
my $groups = $c->db->get_hostgroups(sort => {'ASC' => 'name'});
my $nr = 0;
my $x  = 20;
my $y  = 30;
for my $group (@{$groups}) {
    $dashboard->{'panlet_'.$nr} = {
        "xdata" => {
            "appearance" => {
                "iconset" => "default_64",
                "type" => "icon"
            },
            "cls" => "TP.HostgroupStatusIcon",
            "general" => {
                "hostgroup" => $group->{'name'},
            },
            "label" => {
                "bgcolor" => "#cccccc",
                "bordercolor" => "#aaaaaa",
                "bordersize" => 1,
                "fontbold" => "",
                "fontcolor" => "#000000",
                "fontfamily" => "inherit",
                "fontitalic" => "",
                "fontsize" => 10,
                "height" => "",
                "labeltext" => "<center>".$group->{'name'}."</center>",
                "offsetx" => 0,
                "offsety" => 42,
                "orientation" => "horizontal",
                "position" => "center",
                "width" => "60"
            },
            "layout" => {
                "x" => $x,
                "y" => $y,
            }
        }
    };
    $x = $x + 70;
    if($x > 500) {
        $x = 20;
        $y = $y + 90;
    }
    $nr++;
}

# update every 10 seconds
$dashboard->{'ts'}                          = time()-time()%10;
$dashboard->{'tab'}->{'xdata'}->{'refresh'} = 10;
Shell Scripted Dashboard
This example is a simple shell script which has label with the current time.
#!/bin/bash
# title:  Scripted Bash
# user:   thrukadmin
# groups: [{"*" : "read-only"}]

LABEL="Dynamic dashboard<br>generated at: $(date)";

cat<<EOT
{
   "file_version" : 2,
   "panlet_1" : {
      "xdata" : {
         "appearance" : {
            "type" : "icon"
         },
         "cls" : "TP.TextLabelWidget",
         "label" : {
            "bgcolor" : "",
            "bordercolor" : "",
            "bordersize" : 1,
            "display" : "always",
            "fontbold" : "",
            "fontcenter" : "",
            "fontcolor" : "#000000",
            "fontfamily" : "",
            "fontitalic" : "",
            "fontsize" : 14,
            "height" : "",
            "labeltext" : "$LABEL",
            "offsetx" : 0,
            "offsety" : 0,
            "orientation" : "horizontal",
            "position" : "top-left",
            "roundcorners" : "",
            "width" : ""
         },
         "layout" : {
            "center" : "centered",
            "x" : 4,
            "y" : 28,
         },
         "link" : {}
      }
   },
   "tab" : {
      "xdata" : {
         "refresh" : "90",
         "title" : "Dashboard"
      }
   },
   "ts": $(date +%s)
}
EOT