Benchmarking Thruk
I often get asked if there are any benchmarks for Thruk so i finally decided to do some tests.
Test Setup
Since OMD made it so easy and fast to setup a test environment i would be a fool to not use it for tests too.
In order to create test hosts and services i used the Monitoring::Generator::TestConfig Perl module and wrapped a simple perl script around (gui_benchmark.pl on GitHub).
Used Versions:
- Thruk 1.1.1
- Nagios 3.2.3
- Icinga 1.5.1
The tested hardware is a quad core i5 with 8gb memory installed.
Test:
. create test services . submit some passive check results . wait till the checks are processed by the core . stop the core so it does not waste cpu cycles . run Apache Bench (ab) 5 times for each gui and take the fastest result
The rests itself consists of 100 requests with 5 concurrent requests.
Result
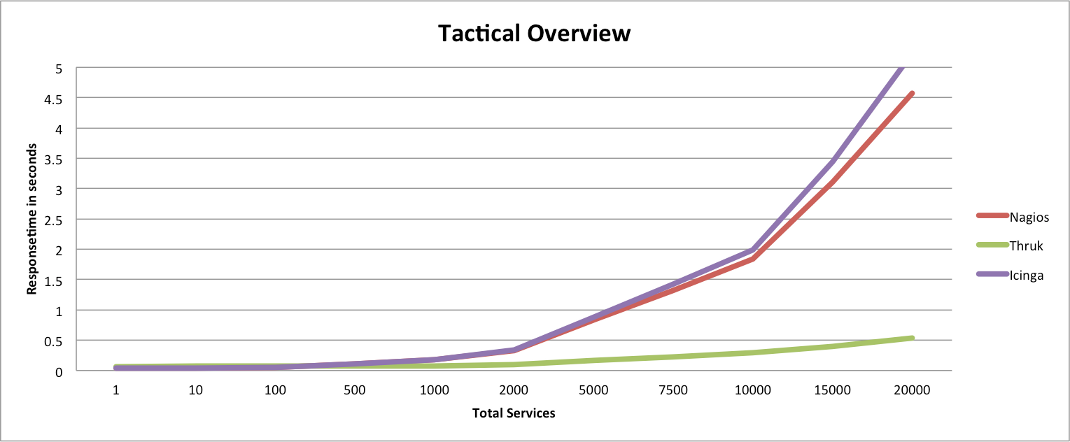
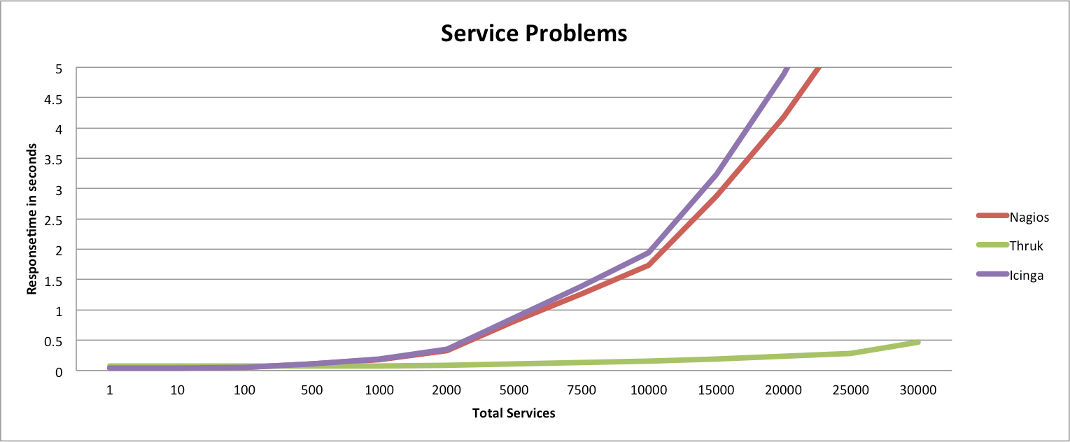
The following charts draw the response time for some common pages. Lower response times means faster pages.
-
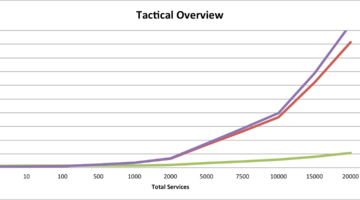
- Tactical Overview
-
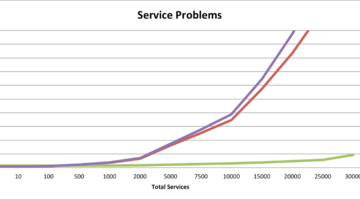
- Service Problems
-
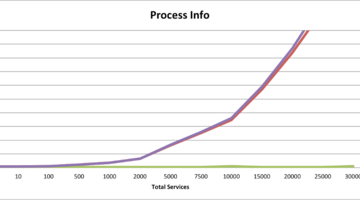
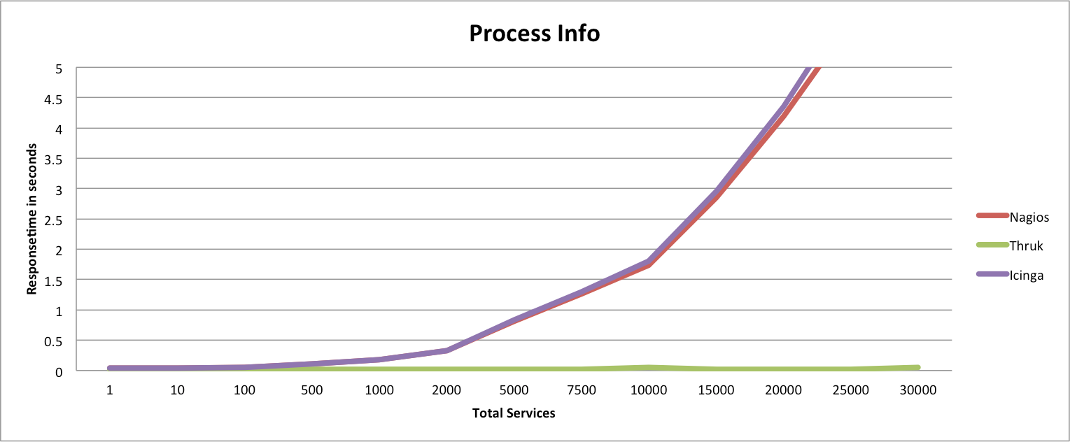
- Processinfo
-
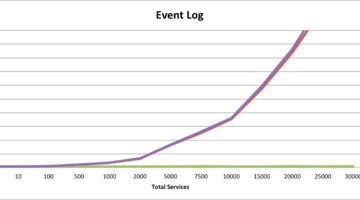
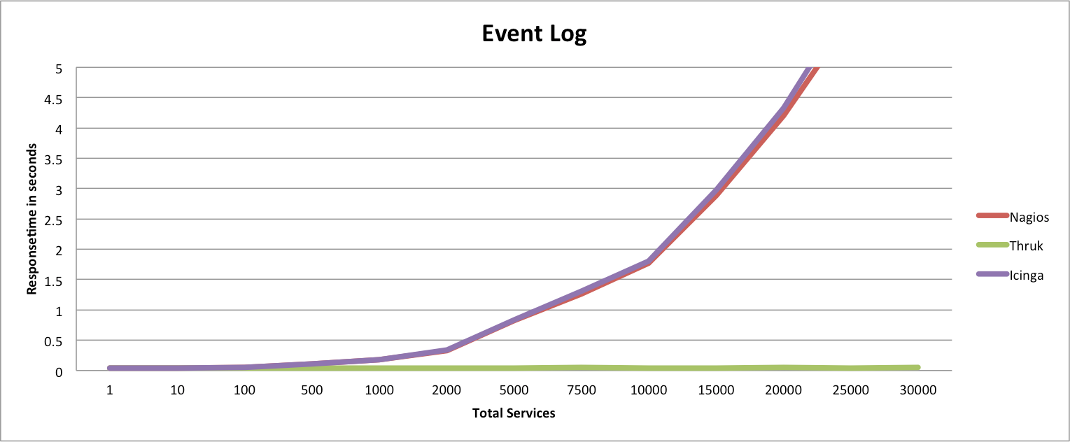
- Eventlog
The response time contains only the response of the main page content. Your browser will propably take longer because it has to fetch images and css stylesheets and render the hole page.
Conclusion
The images speak for themselves, parsing the status.dat for every request takes time and increases linear with the amount of services. Requesting only the needed data for the specific page via livestatus has a much lower overhead and is therefor much faster, but still increases linear with the amount of services of course. Just at a much lower rate.
The biggest performance issues for the status.dat based CGIs is on pages where no or nearly no data is needed, like the process info page or the commands page. The repsonse time for Thruk stays nearly constant where Nagios or Icinga still need to parse the hole status.dat.
Main factor for Thruks response time is the amount of data returned for each query. The more data on a page, the longer it takes. That’s one reason why Thruk usually uses paging on larger pages.